I was recently surprised when I received the free publication online from JAMA of the “The Association Between Income and Life Expectancy in the United States, 2001-2014” by Chetty, et. al. An added bonus to the JAMA paper was the discovery that the New York Times had used it to produce two articles with interactive graphics that let the reader easily explore the impressive wealth of information that was published in the article. When you click on the New York Times link above you will open up to an article that has a map that will allow you to click on any spot in the country and understand what the life expectancy is there.
A second article in the Times has an interactive graphic that allows you to type in the name of a location and get even more gender and income specific information and to see a map of surrounding markets. The graphics in this article also show Medicare spending per beneficiary in the area of inquiry and life expectancy by income. For example, if I type in the market where I now live, which is Merrimack County in New Hampshire and then compare what I see to what I find when I type in my previous home in Norfolk County in Massachusetts, I can see that the average poor individual would lose a full year of life expectancy if they moved moved from Wellesley, MA. to New London but would still be a half year better than the average for the poor across the country. The location specific information also allows me to see that in my area of New Hampshire 12.7 % of the population is uninsured and Medicare spends $8200 per individual or $1500 less than the national average of $9700. In Wellesley and Norfolk County 3.6% are uninsured and the average Medicare expense is $9900 or about $ 200 a year greater than the national average.
The shocking reality though is that living in New London at my income level I am scheduled to live eight years longer than the average poor person in the same country (income less than $28,000). When you look at my status in New Hampshire by income, adjusted for race, you see that I can expect to live a year longer than if I still lived in Wellesley. It is always great to know that you made the correct strategic call! The advantages for a retired old guy with some means makes sense to me. If you are financially secure, you are better off in semi-rural New Hampshire than fighting the traffic hassles of living in Boston’s western suburbs. If you are poor you are better off in Eastern Mass even if it means sitting in traffic! I hope that you realize that this silliness is my attempt to get you to play with the data and draw your own insights.
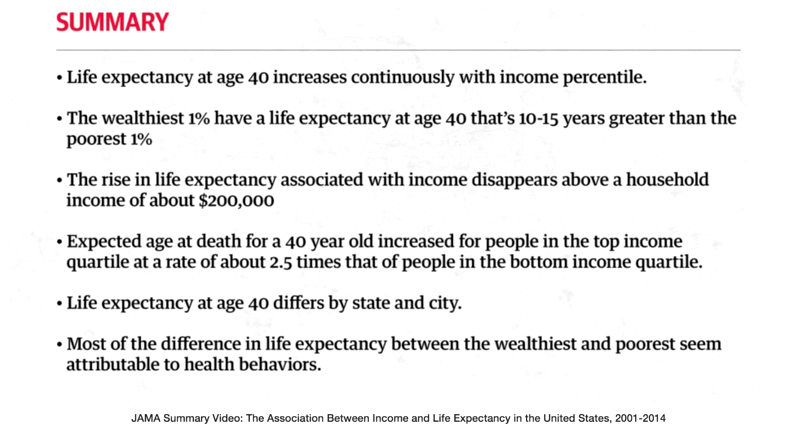
There are a couple of other tools that I would like to give you to process this new information. Big data is a new challenge for many of us in healthcare; so the wealth of educational tools that JAMA has put out to help us understand the story that the data is telling is an effort that I hope you will find beneficial. There is a great video presentation of less than five minutes that explains the work and is well worth your time if all you have is five minutes to invest.
Here is a screenshot from that video that highlights the most significant findings of the study.
There are also three editorials that you can read, the best by Nobel Laureate, Angus Deaton who won the Nobel Prize for economics in 2015 “for his analysis of consumption, poverty, and welfare”; and finally a podcast of thirty minutes that is a conversation between the JAMA editor and Dr. Chetty, the lead author, and Professor Deaton who wrote the editorial. Finally, there is an executive summary!
There are obvious connections between this article and my recent post about disparities in healthcare. As the life expectancy data stresses, attempts to improve access to better care makes more difference for the poor, and even those who are not poor but earn less than $200,000 than for the wealthiest 1% who have seen not only a disproportionate increase in their wealth but also in their longevity over the last fourteen years.
I hope that the case I made in that recent post convinced you that it is not enough to only focus on improving care in the office. Our efforts within the system of care will be insufficient to maximize health for any individual who lives in a community where there are healthcare disparities. I implied that government policy and coordinated private charitable efforts to improve the social determinants of health would be required to achieve the Triple Aim. Good office and hospital care is necessary but insufficient for realizing the Triple Aim. My inference was that many of the social determinants of health are beyond the direct intervention of our current health system. Investments and public participation in new and more robust social programs are needed. Determinates of health like better education, job opportunities, housing, stable families, improved cultural opportunities and all of the things that we would associate with a better life for everyone that would support improvement in health will require social and political solutions that seem nearly impossible to us. As Bert, the old philosopher from Maine, said, “You can’t get there from here!”
One of the things that needs to be understood or emphasized about the study is that it looks only at the impact of income on life expectancy beginning at age forty. That takes out the issues of death from poor maternal child health and many of the issues of death from violence and drug use in teenagers and young adults. The study is adjusted somehow for race, presumably since race naturally varies by geographical area. I am sure that the egregious differences in life expectancy by income would be even greater if these adjustments had not been made.
The data is complex but underneath it all is the same question, “How do we reduce socioeconomic disparities in health outcomes?” This article definatively proved that income does make a difference in health. What was surprising was that geography perhaps makes a bigger difference or said another way, a community can mitigate the impact of low income on health outcomes by ensuring better care for everyone no matter what their income. The study demonstrates that public efforts to improve access to good care and a focus on exercise, obesity, and smoking can ameliorate much of the negative impact of income on longevity and these efforts seem to compensate for some of the healthcare disparities that also exist in other locations where there is no clear public policy to focus on the health needs of the poor and underserved.
The scope of this study is staggering. The authors used data from 1.4 billion anonymous earnings and mortality records to construct better estimates of the relationship between income and life expectancy at the national level than has ever before been possible. This was an exercise in “big data”. The character of the data was so robust that they were able to construct county and metro area estimates of life expectancy by income group and identify many factors that are associated with higher levels of life expectancy for low-income individuals.
The data should give us all reason to be ashamed of the outcome of our collective political and economic choices just as it shows us how to begin to improve the life expectancy of many of our poor. Below I have interspersed my thoughts with comments from the executive summary:
The richest American men live 15 years longer than the poorest men, while the richest American women live 10 years longer than the poorest women. The poorest men in the U.S. have life expectancies comparable to men in Sudan and Pakistan; the richest men in the U.S. live longer than the average man in any country.
The analysis of the “big data” reveals through its demonstration of variation by location that we can hope that even short of raising income there are ways of mitigating the negative impact of some social determinants of health. The variation by location of life expectancy among the poor suggests that there are lessons to be learned and applied from those cities where the life expectancy of the poor approach the outlook of the wealthy. It is clear that causality for shortened life expectancy is a complex subject.
Importantly, these findings do not necessarily imply that income has a causal effect on life expectancy: that is, giving someone more money may not increase their lifespan. The association between income and life expectancy may be driven by unmeasured factors correlated with both health and income, such as differences in education or health behaviors.
There is good reason for urgent consideration of what this data means because the gaps seem to be growing fast.
Inequality in life expectancy has increased in recent years at the national level. Between 2001 and 2014, individuals in the top 5% of income distribution gained around 3 years of life expectancy. In contrast, the lifespans of Americans in the bottom 5% of the income distribution did not increase between to 2001 and 2014.
We must conclude that we have more to learn from understanding why there is significant variation across the country. It is better for your health to be poor in San Francisco, Brooklyn or the Bronx than in Detroit, Gary, or Tulsa. Life expectancy for lower income populations varies by about 5 years from the best places to the worst places which seem to be clustered in the old “rust belt” regions in Michigan, Ohio, and Indiana. Nevada is the worst and Kentucky, Tennessee, Arkansas, Oklahoma, and Kansas get dishonorable mention. Some places in the country actually got worse in the fourteen years of the study. Tampa is an example of that sad fact.
The data also suggests that if you are poor your life expectancy is better if you are surrounded by the wealthy in cities where there are investments in public services. The best news in the study for the poor is that their life expectancy is positively affected by a healthy lifestyle with less smoking, more exercise and less obesity. Indeed:
The variation in medical care across areas at any given point in time may be small relative to other factors that affect longevity, such as smoking and obesity.
The conclusion of the authors is surprisingly positive and hopeful:
Our findings show that disparities in life expectancy are not inevitable. There are cities throughout America — from New York to San Francisco to Birmingham, AL — where gaps in life expectancy are relatively small or are narrowing over time. Replicating these successes more broadly will require targeted local efforts, focusing on improving health behaviors among the poor in cities such as Las Vegas and Detroit.
I see a silver lining to the cloud of disparities in healthcare. Waiting through the generations required to improve education, jobs, housing and income inequity may not be necessary for us to see improvements in health across all populations. This study suggests that helping the poor find better ways to quit smoking, lower their blood pressure, and lose weight can make a difference even before we resolve the more daunting social issues. The scriptures say that we will always have “the poor with us”. This article in JAMA says that even though the poor will be with us, the poor can live longer in a supportive environment and our collective efforts can result in a significant improvement in their health. Is that not what we consider to be our work?